Citibank Holographic Workstation
A futures trading application for Hololens
Partners
Heather Raikes (Creative Director)
Thomas Huang (3D Art Direction)
Galen Drew (Interaction & UI Designer)
Kevin Maxon (Unity Developer)
Kyle Warbis (Unity Developer)
My Role
User Experience design
Interaction design
User Interface design
Client
Challenge
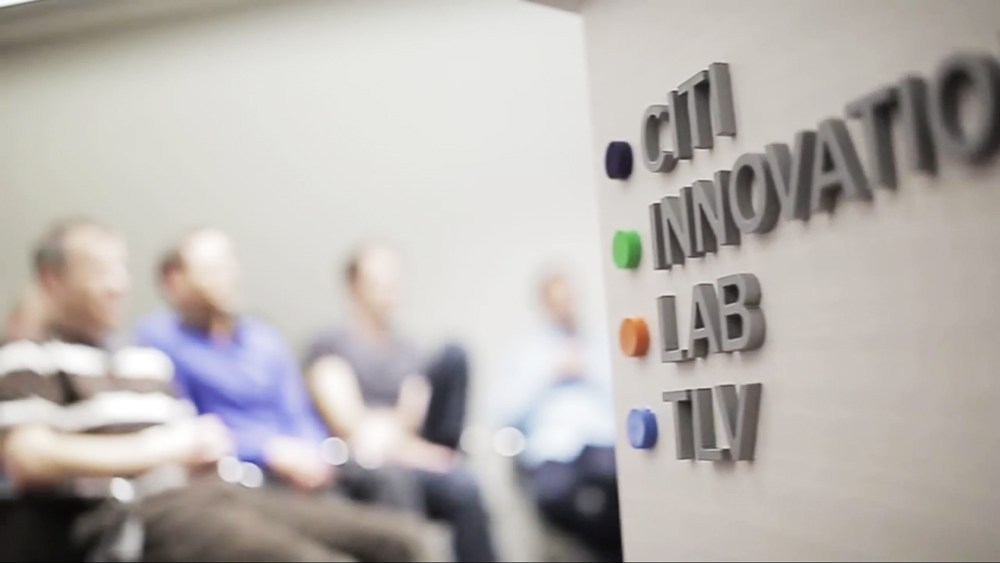
8ninths was chosen as 1 of 7 agencies to participate in the Hololens Academy for Microsoft Build 2016. Microsoft challenged our team to demonstrate how the unique capabilities of Augmented Reality can solve for enterprise problems. In response, we partnered with Citi Innovation Lab to explore how 3D computing technology can create efficiencies in the world of futures trading.
Problem Space
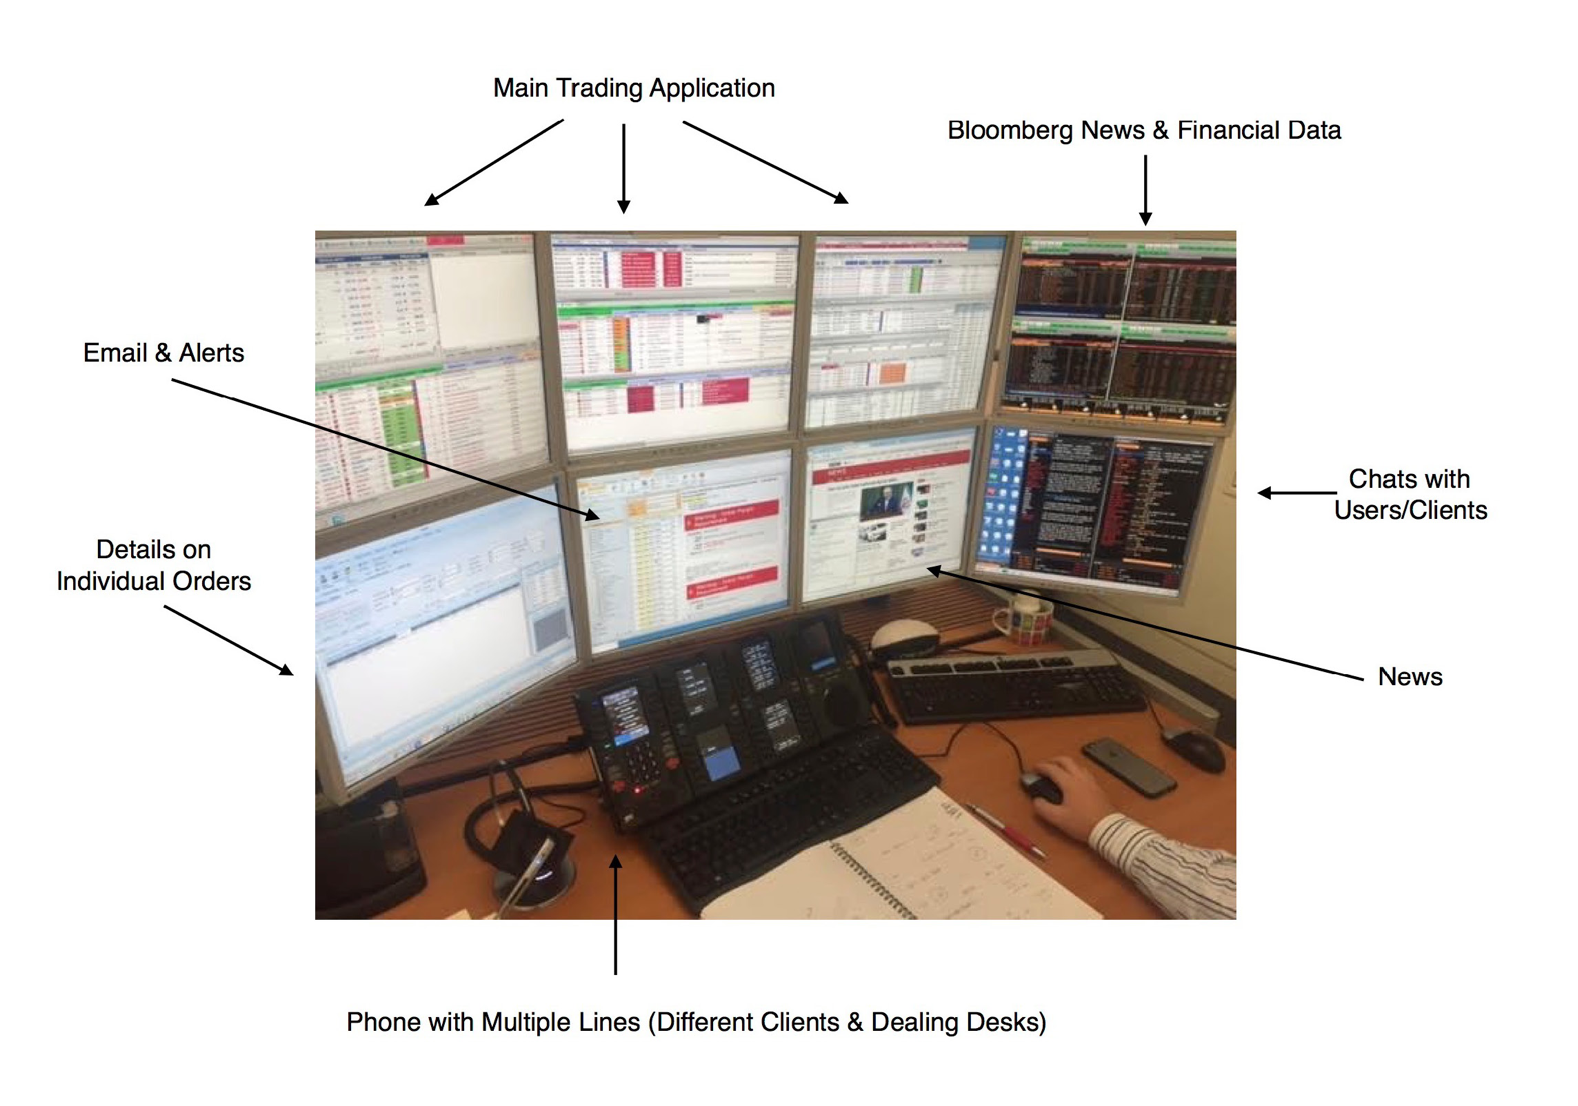
In the world of futures trading, millions of dollars are on the line at any given moment of the day. Any significant increase in efficiency presents an opportunity to change the game for the entire field. Traders must be prepared to act instantly and accurately. The digital era brought data to the trader’s desk. But losing the human element of the open outcry pit has brought about new challenges.
In our interviews with Citi traders, they noted a loss of the human element, our instinctual ability to recognize critical patterns and market changes in the environment of the “Pit.” Sound—The roar of the crowd was a key indicator of activity. Placement—Trader’s could follow the sound, the gaze, the gestures to corners of the room where data was positioned. Now, with anywhere between 6 and 12 screens of data, traders struggle to prioritize and navigate between browser windows, spreadsheets and tabs, news sites, and email—resources that they access regularly within seconds of one another. These traders also expressed pain points in collaboration. Their clients lack visibility into the data and knowledge gaps to hurdle in negotiations. Notifications can be as bothersome as they are helpful, lacking prioritization themselves in the battle between applications. Chat and email are an ongoing necessity to be available when the iron strikes, but these applications only create more windows to monitor at their already busy workstations.
Solution
Our creative team saw a variety of opportunities for Microsoft Hololens to address these issues. We ideated to lift the screen and activate reference data with voice and gesture, presenting data in 2D and 3D (only where appropriate), and optimizing communications with Holographic “screen” sharing and voice activated calling. If we could increase efficiency and reduce cost cognitive load, the solution of a Holographic Workstation could lend itself to far more applications for data interpretation and collaboration.
Features
Augmented Data
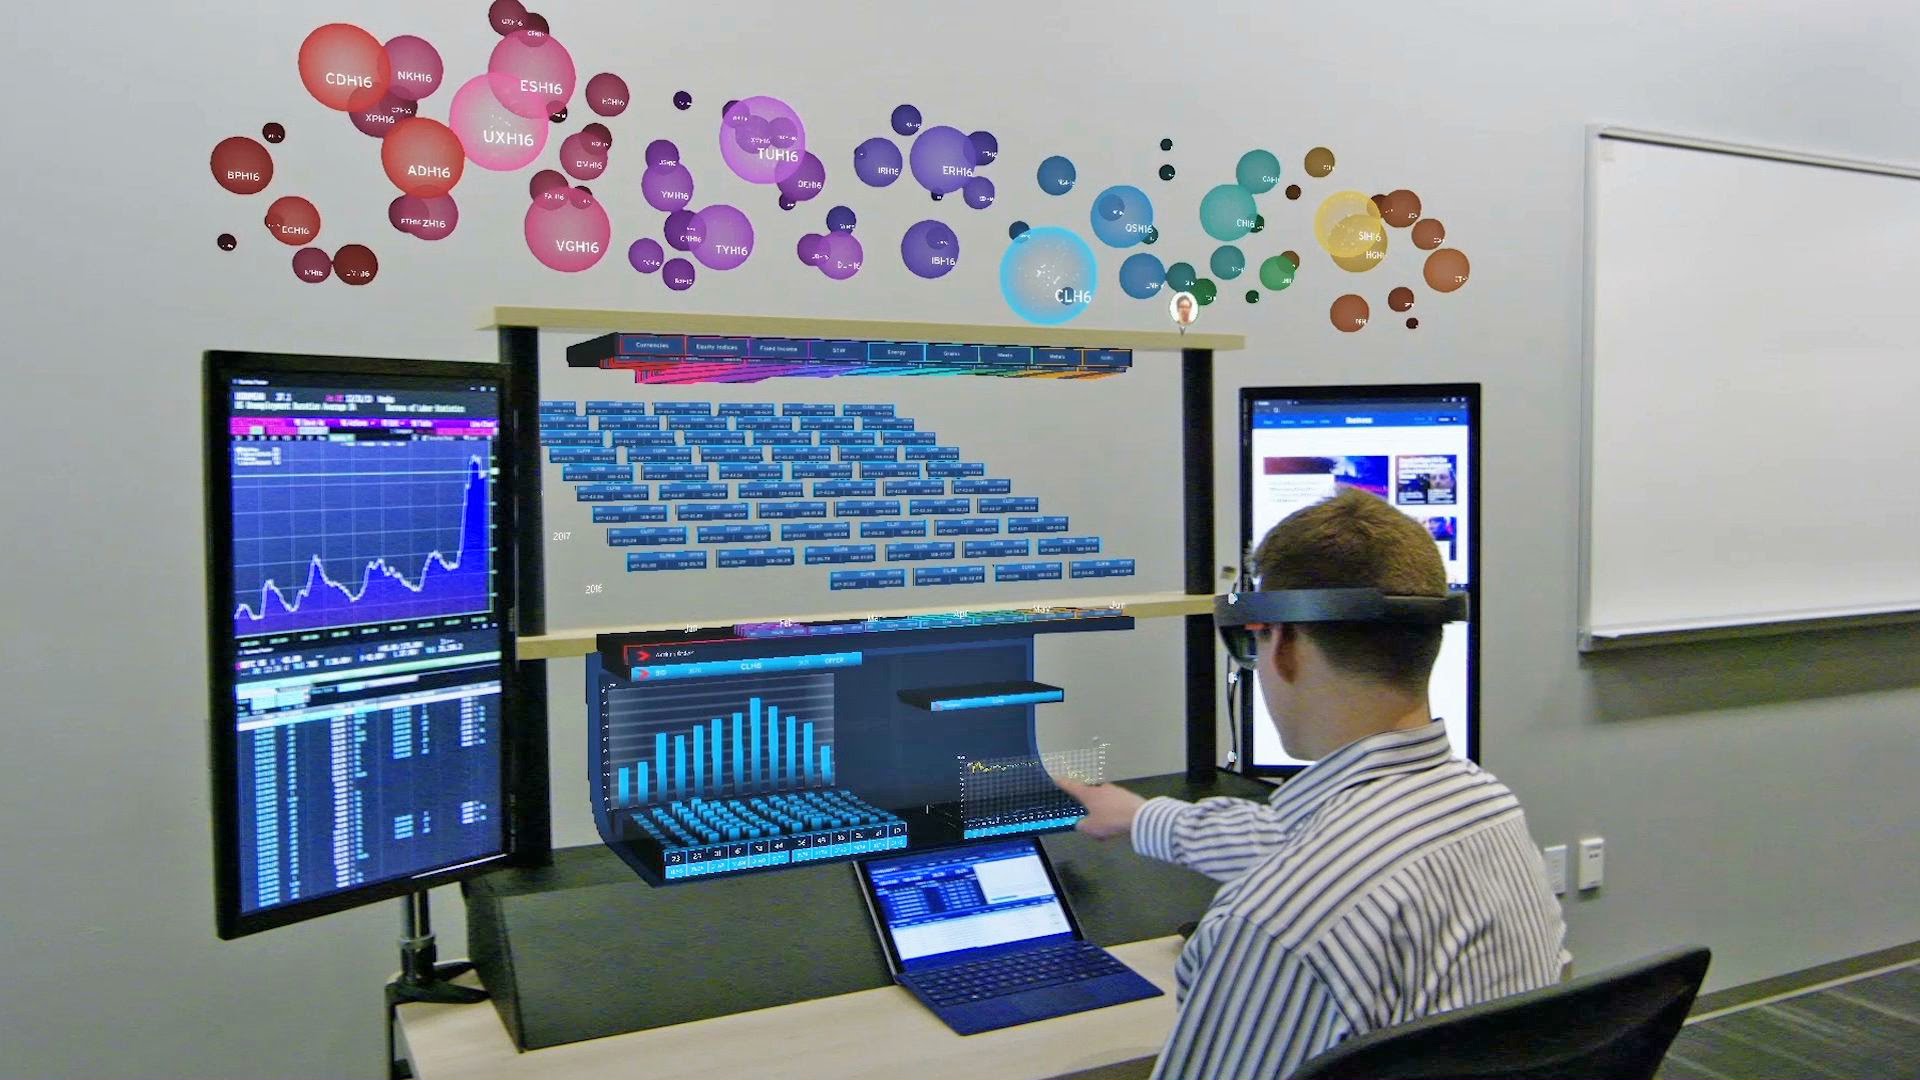
The Citi Holographic Workstation leverages augmented reality to present volumetric data where it counts. Financial instruments with the greatest rate of change over time swell in size for instant recognition and action. 3D Histograms of financial instruments display 3-axis for non-abstracted analysis.
Voice and Gesture
Holographic computing enables traders to view, prioritize, and take action with voice and gesture commands, eliminating frustrations that arise in manipulating one mouse between 6-12 monitors of data.
Augmented telecommunications
A united framework for voice calling and holographic “screen” sharing helps traders to give data transparency to their clients. Traders simply dock the phone line (client’s avator holo object) to the preferred tier of the holographic workstation.
Instinctive Animation
A “cloud layer” of financial asset classes represents rate of change (bid/sell volume) over time in volumetric bubbles. Selecting a class from above causes its financial instruments to “rain” down into the central tier of the workstation for closer inspection.
Process
With a timeline of 6 months and a brand new, never been seen Hololens dev kit, our creative team had no easy task ahead. Heather and I led bi-weekly meetings with Citi trading stakeholders to define requirements and align scope and approach. In those 6 months, I analyzed research collected by the team, spreadsheets of financial data, drove the creation of user stories and tasks, delivered narrative storyboards, wireframes and prototypes of interactions, visual design direction, testing and insights to iterate on the implementation.
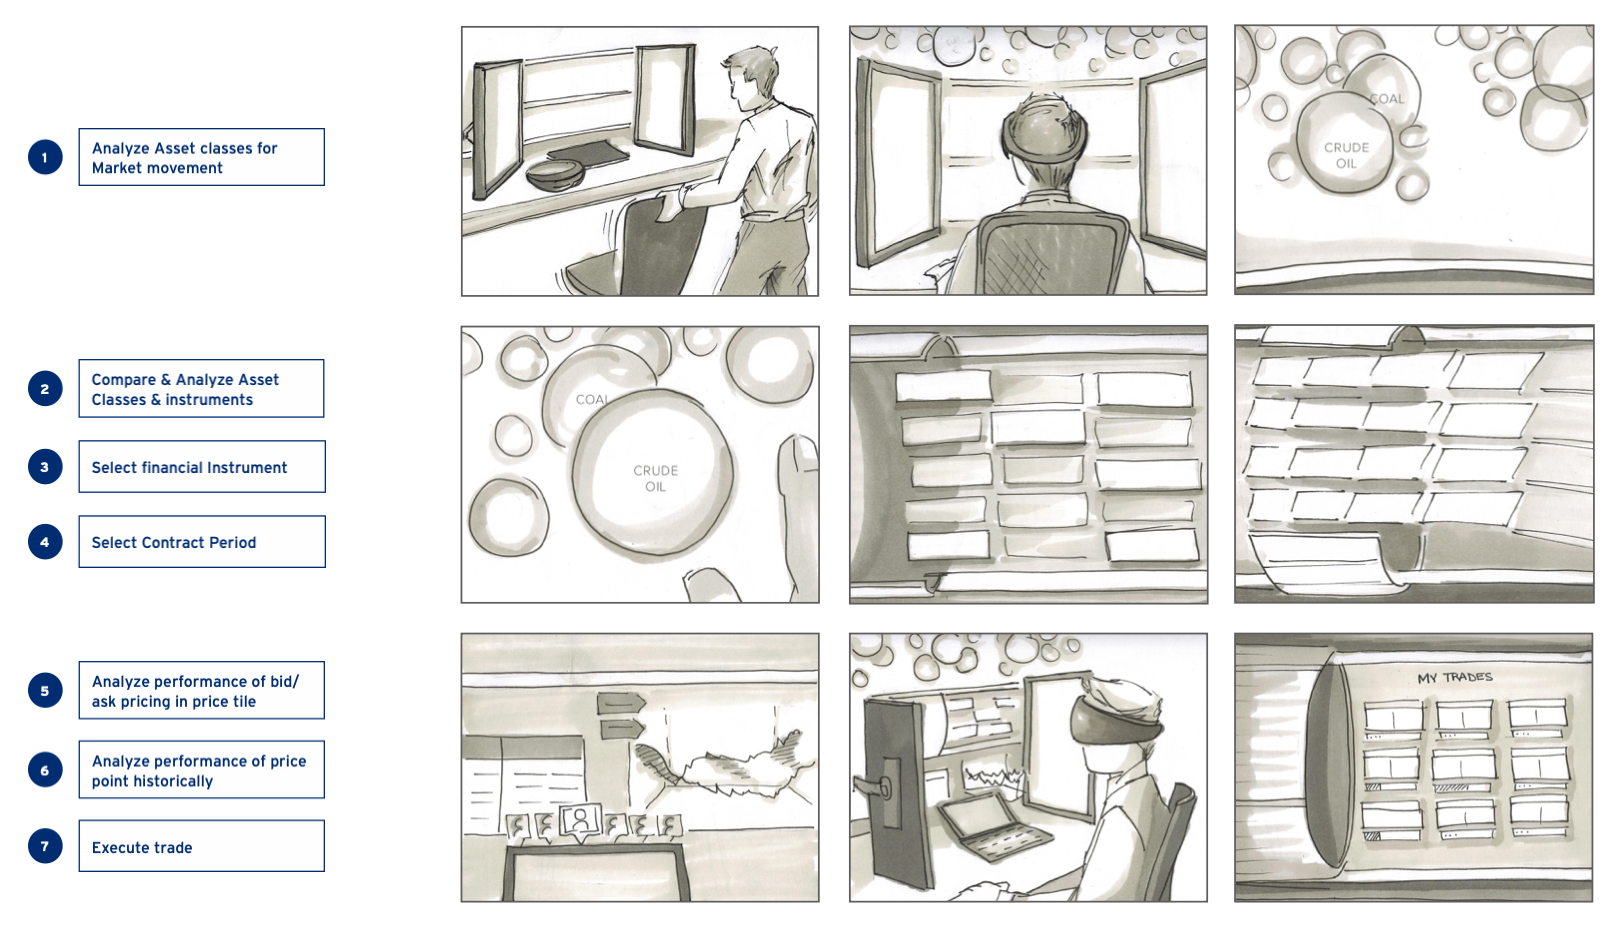
Scenarios & storyboarding
To tell a clean, cohesive narrative for Microsoft Build, we needed
but conversations with the traders were circuitous and full of anecdotes, complexity tangents consistent with their reference points for their process…..blah.
To make sense out of chaos, I stepped in to drive conversations about specific user scenarios, down to individual tasks, and documented these for everyone to agree upon.